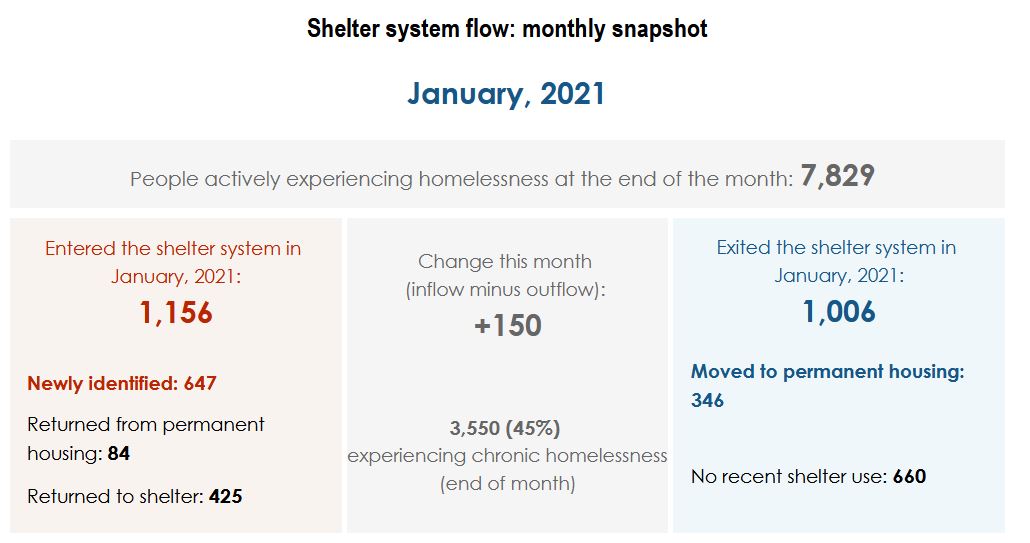
Despite the pandemic’s ongoing impact on homelessness serving systems and people experiencing homelessness, Toronto took a bold step this week when it publicly released its Shelter System Flow data, which will help inform progress towards their goal where experiences of homelessness in the city are rare, brief, and non-recurring.
Toronto now has a much more comprehensive picture of those accessing the shelter system than traditional measures that focused only on nightly occupancy and capacity. This data on Toronto’s municipally funded shelter system transparently shows how many people are entering and leaving the shelter system in a given month.
The data dashboards visually display aggregate data, including anyone who has recently accessed a shelter, respite, hotel/motel program, or warming centre within the last three months. Toronto’s team is comprised of the Toronto Alliance to End Homelessness, the Toronto Indigenous Community Advisory Board, the City of Toronto Shelter Support and Housing Administration, , and many community-based shelter and support services. This team intends to expand and include more people experiencing homelessness in the city—including people who are sleeping outdoors. With this, Toronto will become one of the largest cities in North America to have a quality By Name List which they can then use to further inform permanent solutions to homelessness.
“This new data is one of the critical tools we need to make homelessness in Toronto rare, brief and non-recurring,” says Kira Heineck, Executive Director of the Toronto Alliance to End Homelessness. “It will enable both community service providers and the City to respond more effectively to the needs of people experiencing homelessness and highlight the impact of targeting our resources and strategies to permanent solutions to homelessness.”
Two data dashboards have been created by the Built for Zero Canada community in Toronto: The Monthly Snapshot dashboard highlights the inflow and outflow of people to and from the shelter system in the reporting month; and the Historical Trends dashboard captures the inflow and outflow of people to and from the shelter system over time. The latter dashboard will allow users to filter data by sub-populations and specific time periods by using the built-in filtering options.
Basically, these data dashboards will provide a better understanding of who is experiencing homelessness, the impact of funding and policy decisions, and the scale of the homelessness in Toronto—and this information will be accessible and open to the public. In addition to the dashboards, the data is also available for download on the city’s Open Data Portal.
“These new reporting dashboards are an important step in our collective efforts to addressing homelessness in Toronto and are an important part of the City’s data modernization efforts.” says Toronto Mayor John Tory. “I look forward to the improvements and adaptations to the shelter system this data will bring to light.”
The best way to successfully reduce and achieve a functional end to homelessness is to know the complete extent of how many folks are experiencing homelessness in the community. Toronto’s work to create and maintain these two dashboards are a foundational achievement that sets them on the path to better understand how people flow in and out of homelessness and strengthen their investments to ensure that any experience of homelessness is brief and non-recurring.
Real-time data is key
Real-time data is a critical component of ending homelessness. It enables communities to understand how they’re doing and can inform quicker, more responsive decision-making. The data includes unique people who have used an overnight homelessness service at least one time in the past three months, including sub-populations such as chronically homeless, families, unaccompanied youth, single adults, refugees, and non-refugees. Indigenous data is not currently included but Toronto is working with their Indigenous partners to release that information as part of the dashboards in the future.
The indicators included in the data dashboards will help in the development of a Coordinated Access system in Toronto. Coordinated Access ensures that people who experience homelessness can easily connect to a high functioning system that understands their needs and can quickly connect them to appropriate and available housing and supports.
“SSHA is excited to share this new data and to provide a solid foundation for making system improvements and support our continued efforts towards ending homelessness in Toronto. The Built for Zero community has been an incredible support and we look forward to continuing to work together with our partners at the TAEH, TICAB, and CAEH to continue to enhance the data, and to use the information to further inform system planning and operations” says Mary-Anne Bédard, General Manager, City of Toronto, Shelter Support and Housing Administration.
What’s next?
Over time, data will be expanded to include more people experiencing homelessness in Toronto—from people sleeping outdoors and/or using other homelessness services as the technical capacity of data management systems are enhanced.
Demographic information, for instance, currently available is on age and gender but it will be expanded over time to include racial identity, Indigenous identity, and veteran status.
“This is the most comprehensive and transparent public dashboard of its kind in Canada,” says Tim Richter, President and CEO, Canadian Alliance to End Homelessness. “Armed with this real-time, person specific data, Toronto will now be able to better target resources, improve homeless system coordination and most importantly, accelerate reductions in homelessness.”
Data for each month will be published on the 15th day of the month and made available on the Open Data Portal, in addition to the city’s website.
This blog is a part of our Bright Spot series highlighting outstanding work in ending homelessness happening across Canada.

